Ethics statement
All procedures involving human participants were conducted in accordance with the 2013 revision of the Declaration of Helsinki and the ethical standards of the relevant institutional and national research committees. All participants provided written informed consent for the use of clinical data and biomaterials for research purposes. The study was approved by the relevant local ethics committees at participating centers, including the Comitato Etico Aziende Sanitarie Regione Umbria (19369/AV and 20942/21/OV), the Amsterdam UMC VUmc Medical Ethics Committee (2019.102), the Sant Pau Ethics Committee cohort, the Ethics Committees of Motol University Hospital and St. Anne’s University Hospital (CBAS) cohort and the relevant ethics and biobank governance bodies overseeing the IBB/BIODEM cohort. Local health authorities approved the VARS patient follow-up program at the Queen Sofia Alzheimer’s Center (ref. no. MCB/RMSFC, record no. 12672).
Participants and inclusion criteria
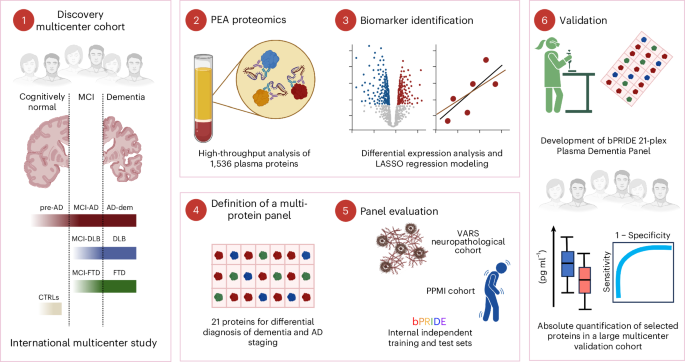
The total discovery cohort (1,318 plasma samples initially included in this project) were collected from individuals enrolled across six different international cohorts: Amsterdam Dementia Cohort (ADC) (the Netherlands; n = 221; all groups43), Sant Pau Initiative on Neurodegeneration (SPIN) (Spain, n = 220; all groups44), University of Perugia (UNIPG) (Italy, n = 167; all groups21), Ulm University (UU) (Germany, n = 174; all groups except MCI-DLB45), BioFINDER (Sweden, n = 383; CTRLs and complete AD-cont46) and AIBL (Australia, n = 153; controls and complete AD continuum47). An independent large multicenter cohort similar to the discovery one from ADC (n = 179; all groups), SPIN (n = 137; all groups), UNIPG (n = 119; all groups), UU (n = 38, controls and FTD), AIBL (n = 104; controls and complete AD continuum) and CBAS48 (n = 159; all groups) together with an autopsy-confirmed AD/DLB cohort coming from BIODEM and the neurobiobank of the IBB/UAntwerp49 (total n = 69; AD and DLB) was used to validate the custom panels.
For all the samples, the presence of AD pathology was tested either by using AD CSF biomarkers (CSF Aβ42 or Aβ42/40, Tau phosphorylated at threonine 181 (pTau181) and total Tau (t-Tau), all cohorts) or amyloid and Tau-PET (most patients from the AIBL cohort). The clinical groups included were cognitively unimpaired controls (CTRLs) without biomarker evidence of Aβ pathology (ndiscovery = 374; nvalidation = 108); cognitively unimpaired individuals with Aβ pathology (pre-AD; ndiscovery = 186; nvalidation = 108); individuals with MCI because of AD (MCI-AD; ndiscovery = 164; nvalidation = 116, with positive AD biomarkers); individuals with MCI because of FTD (MCI-FTD; ndiscovery = 46; nvalidation = 34); individuals with MCI because of DLB (MCI-DLB; ndiscovery = 25; nvalidation = 36); individuals with AD-dem (ndiscovery = 182; nvalidation = 171, with positive AD biomarkers); individuals with FTD (ndiscovery = 170; nvalidation = 126); and individuals with DLB (ndiscovery = 171; nvalidation = 106). In the discovery cohort, two patients with FTD (with MAPT and C9ORF72 mutations) and 12 with DLB had missing Aβ status. In the validation cohort, five CTRLs and 33 individuals with FTD from UU, together with two individuals with DLB and four with MCI-DLB from the CBAS cohort, had missing Aβ status. CTRLs included individuals with subjective cognitive decline, in whom objective cognitive and laboratory investigations were normal (that is, criteria for MCI, dementia or any other neurological or psychiatric disorder not fulfilled) with negative AD biomarkers (except from the few exceptions within the validation autopsy cohort mentioned above)43,50. All participants of each cohort underwent standard neurological and cognitive assessments; the diagnosis was assigned according to international consensus criteria for MCI-AD51, AD-dem52, DLB53 and FTD54,55. Cases with DLB in the discovery cohort with available Aβ biomarkers were further split for Aβ co-pathology (n = 86 Aβ+, n = 70 Aβ−). The MCI-DLB and MCI-FTD discovery groups contained a very small number of participants with regard to the number of measurements and were considered just for basic univariate analyses. Plasma samples were collected according to standardized international guidelines56. The only two reported preanalytical differences across centers were the addition of prostaglandin E1 to EDTA tubes collected by AIBL and the use of citrate plasma for VARS.
The MMSE or the Montreal Cognitive Assessment test were used as a measure of global cognition. CSF markers were analyzed locally as part of the diagnostic procedure using commercially available kits (ADC, AIBL and UU: ELISA INNOTEST, Fujirebio; ADC: Elecsys biomarker assays, Roche Diagnostics; SPIN, UNIPG and UU: Lumipulse G600, Fujirebio; BioFINDER: Euroimmun ELISA assays). All samples from the AIBL cohort were defined based on Aβ and Tau-PET. A positive CSF AD biomarker profile was defined locally in the different cohorts as follows: in ADC as Aβ+ (INNOTEST Aβ42 < 813 pg ml−1; Elecsys Aβ42 < 1,000 pg ml−1) and Tau+ (INNOTEST p-Tau181 > 52 pg ml−1; Elecsys p-Tau181 > 24 pg ml−1); in BioFINDER as Aβ42/Aβ40 < 0.088 and either p-Tau181 > 65.04 pg ml−1 or t-Tau greater than 462.91 pg ml−1; in SPIN as Aβ42/Aβ40 < 0.062 and either t-Tau greater than 456 pg ml−1 or p-Tau181 > 63 pg ml−1; in UNIPG as Aβ42/Aβ40 < 0.072 and p-Tau181 > 50 pg ml−1 (regardless of t-Tau); in UU as Aβ42 < 450 pg ml−1 and either t-Tau greater than 380 pg ml−1 or p-Tau greater than 65 pg ml−1; in CBAS as either CSF biomarkers (Aβ42 < 526 pg ml−1 and p-Tau181 > 50.2 pg ml−1) or amyloid PET positivity; and in AIBL based on amyloid and Tau-PET (amyloid PET+ greater than 25 centiloids; Tau-PET+ meta-temporal standardized uptake value ratio greater than 1.19). The methodology and cutoff values used for each cohort and each biomarker are summarized in Supplementary Table 7. In addition, for the discovery cohort, anamnestic data on six common systemic comorbidities (dyslipidemia, diabetes, hypertension, hypothyroidism, chronic kidney disease and obesity with a body mass index greater than 30), were collected for most participants (n = 823 for most comorbidities; n = 418 for obesity). These data were used to assess potential confounding effects on plasma protein levels. The autopsy IBB cohort analyzed in the validation of the custom assay included cases with a definite diagnosis according to international neuropathological examination guidelines for DLB53,57 and AD58. Within the autopsy-defined DLB group (n = 10), coexisting AD pathological changes were reported in five cases. Coexisting cerebrovascular lesions (n = 1), TDP-43 pathology (n = 1) were reported within the autopsy-confirmed AD neuropathological group (n = 60).
Independent data (which include the same 384 PEA panels: cardiometabolic, inflammation, neurology and oncology) generated from the plasma samples collected from patients at the dementia stage with autopsy confirmation of AD, vascular dementia and LBD pathology in the VARS cohort59,60 (n = 129) were used to explore associations between the selected biomarkers and neuropathological scores (that is, Aβ, Tau and αSyn pathology). The composite neuropathological score used to characterize the VARS cohort was the ABC method58 recommended by the National Institute on Aging (NIA) and defined as NIA A, NIA B and NIA C to refer to (A) diffuse Aβ plaque burden (based on Thal phases; 0 = 0, 1 = 1/2, 2 = 3, 3 = 4/5); (B) neurofibrillary tangle burden (based on Braak stages; 0 = none, 1 = I/II, 2 = III/IV, 3 = V/VI); and (C) neuritic plaque location and density (based on the Consortium to Establish a Registry for Alzheimer’s Disease score; 0 = none, 1 = sparse, 2 = moderate, 3 = frequent). Each of the three components is scored 0–3. αSyn pathology was characterized using the Braak αSyn stages61, which are scored from 1 to 6, 1 being disease onset in the lower brainstem and 6 the most severe stage of the disease affecting the neocortex. A summary of these neuropathological scores in the VARS cohort, along with demographic details, is presented in Supplementary Table 1.
The PEA data generated on 221 individuals from the PPMI62 9000 study (projects 196 and 222) were also included to test whether some of the proteins associated to DLB could be associated to other neuronal αSyn diseases63. This cohort included patients with PD (n = 73), healthy CTRLs (n = 97), individuals with pro-PD and individuals with symptoms or genetic mutations suggestive of PD without objective motor deficits (n = 58). All PD and healthy CTRLs were drug-naive at the time of blood sampling; patients labeled as PD but with neuronal αSyn disease staging of 0 (5 of 73) were excluded from the analysis. Data used in the preparation of this article were obtained on 31 August 2024 from the PPMI database (www.ppmi-info.org/access-data-specimens/download-data), research resource identifier: SCR_006431. For up-to-date information on the study, visit www.ppmi-info.org. Data from samples collected at baseline, 6 months, 12 months and 24 months were used for the analysis. The baseline clinical and demographic details of the included individuals are summarized in Supplementary Table 2.
Plasma protein profiling
Proteomic measurements were performed on randomized sample plates according to standardized assay procedures, with laboratory personnel blinded to diagnostic group allocation. In the discovery cohort, a total of 1,536 plasma proteins were quantified using the four specific and validated multiplex-antibody-based protein panels based on the PEA, which were available when the analysis was performed (Explore 384 Cardiometabolic, Explore 384 Inflammation, Explore 384 Neurology, Explore 384 Oncology, Olink Proteomics). Briefly, samples were randomized across 18 plates containing appropriate intra-plate and inter-plate quality controls (QCs) from the manufacturer. Intra-plate and inter-plate CVs for all panels are reported in Supplementary Table 9, with average CVs being below 20%. Each assay has an experimentally determined lower limit of detection (LLOD) estimated as three standard deviations above the noise level from the negative controls that are included on every plate. As QC measures at the individual protein level, we excluded from the analysis protein duplicates, those proteins with more than 15% values below the LLOD and those with more than 15% values associated with QC warnings. As QC measures at the sample level, samples producing more than 35% QC warnings were removed from the subsequent analyses because this typically indicates broader technical issues or suboptimal sample quality. For the included proteins, NPX values below the LLOD were not imputed or substituted because they represent only 0.74% of the total data and we considered the measured values to represent the best available estimates. Following these procedures, 520 proteins and 41 samples were removed (seven AD-dem, 12 CTRLs, four DLB, seven FTD, six MCI-AD, one MCI-FTD, four pre-AD), resulting in 1,016 unique proteins measured in 1,277 individuals. Sensitivity analysis showed that none of the excluded proteins offered better discriminatory value than those retained in the biomarker panel.
Development of custom PEA
A custom-designed multiplex PEA was developed by the manufacturer, according to standardized protocols64,65, to quantify the 21 proteins selected in the discovery cohort. The custom assay was then tested in an independent validation cohort (Table 1). Besides clinical samples, each plate included three replicates of four plasma QC samples (two plasma pools made from patients with AD and two plasma pools made from CTRLs) and three calibrators used for normalization. QC samples and calibrators were measured in triplicate. Each custom assay has an experimentally determined LLOD defined as for the discovery panels. Precision (intra-assay and inter-assay CVs) were calculated using the four QC samples. No cross-reactivity between assays for specific proteins was detected. Assay parameters including LLOD and CVs are included in Supplementary Table 8. Samples from the validation cohorts (n = 805) were randomized across plates and normalized for any plate effect using the built-in inter-plate controls according to the manufacturers’ recommendations, with laboratory personnel blinded to diagnostic group allocation. Protein abundance was reported both in NPX and in absolute quantification (pg ml−1). The same QC measures described above for the discovery cohort were applied within the validation cohort using the custom PEA assay. A total of 83 samples (n = 13 CTRLs, n = 16 pre-AD, n = 6 MCI-AD, n = 16 AD-dem, n = 6 MCI-DLB, n = 2 MCI-FTD, n = 15 DLB, n = 9 FTD) were not included in the analysis because of QC warnings present in more than 19 of the 21 proteins measured within the panel (n = 62) because of sample QC warnings (n = 20) or both (n = 1).
Statistics and reproducibility
Statistical analyses were performed in Python v.3.0, R v.4.2.3 and OriginLab 9. All hypothesis tests were two-sided unless otherwise specified. Sample sizes were determined based on the availability of well-characterized participants across cohorts, with a minimum target of more than 25 individuals per group in the discovery phase. In the validation phase, sample sizes were further expanded to enable the assessment of effects in prodromal groups. No randomization was used to allocate participants to clinical groups, as diagnostic categories were defined according to clinical and biomarker criteria. Differences in demographic variables among groups were assessed using Dunn’s test for continuous variables (that is, age and MMSE) and Fisher’s exact test for categorical variables (that is, sex). Principal component analysis coupled to analysis of variance was used to assess center effects on scaled proteomic data. Logistic regression was applied to analyze the differential protein expression for the pairwise comparison of clinical groups using z-scored NPX or absolute quantification data, adding age or sex as covariates and adjusting P values for multiple testing with Benjamini–Hochberg correction66. The corrected P values have been referred as Q values. Along with Q values and Beta coefficients, Cohen’s d and AUC ROC were also computed for each protein and pairwise comparison. AUC values were averaged between comparisons to rank proteins for their association with AD, DLB and FTD. A similar approach was used to identify promising staging biomarkers for AD by averaging −log10 of Q values and Beta coefficients resulting from logistic regression applied for pre-AD versus MCI-AD, MCI-AD versus AD-dem and pre-AD versus AD-dem comparisons. In the plots, a nonparametric Theil–Sen regression line fitting the data from pre-AD to AD-dem was also added for visualization purposes.
Pathway enrichment analysis was performed using the effect sizes (Beta) and P values obtained from the protein comparison between each diagnostic group (pre-AD, MCI-AD, AD-dem, DLB and FTD) to the CTRL group. We used the R package KEGGREST for the analyses, calculating the difference (Wilcoxon signed-rank test) between the P values in each pathway compared to the background (all other measured pathways). A threshold was set at a minimum count of three proteins measured within the pathway. Otherwise, the pathway was excluded. The pathway effect size is defined as the median Beta of all measured proteins within the pathway. The obtained P values for the pathways were FDR-corrected. The main classes are ranked according to the number of pathways associated with the largest class at the top. Subclasses within each main class were similarly ranked based on the number of pathways, with individual pathways displayed as the final hierarchical level.
For the 21-protein panel selection, we performed multivariable modeling analysis, in which the bPRIDE discovery cohort was randomly split into training (70% of the data) and test (remaining 30%) sets. Each comparison was randomized for each clinical group to keep group prevalences consistent in the training and test sets. For each of the DLB versus CTRLs, DLB versus AD-dem, FTD versus CTRL and FTD versus AD-dem comparisons, 100-fold cross-validated LASSO binomial regression was applied in the training set to analyze the selection proportion of proteins in models by considering a fixed model size of five. The glmnet67 R package was used for this purpose. For the molecular staging of AD, candidates for a composite biomarker were identified using Gaussian LASSO regression, including the clinical stages of AD as numeric variables (pre-AD = 1, MCI-AD = 2, AD-dem = 3). To make the training of this staging composite biomarker as robust as possible, we first filtered the training set by removing participants with MMSE values outside the IQR of each AD clinical stage (n = 82 individuals removed on n = 361 within the training set). The results of the selection proportion analysis, for each comparison, were used to select 21 proteins for a dementia-oriented PEA panel (21 is the maximum allowed size for the physical realization of a custom PEA panel). To evaluate the potential confounding impact of systemic comorbidities (that is, dyslipidemia, diabetes, hypertension, hypothyroidism, chronic kidney disease and obesity) on protein levels, we performed a nonparametric two-way analysis of variance for each protein, using comorbidity status (present/absent) and clinical group as independent variables.
We next applied binomial LASSO regression to train models within the 21-marker panel for the different group comparisons (that is, DLB versus AD-dem, DLB versus CTRLs, FTD versus AD-dem and FTD versus CTRL) and tested their performance on the remaining 30% of the discovery cohort (test set). The internal cross-validation algorithm within the glmnet R package was used to determine the optimal model size based on the penalization parameter at one standard error from the maximum AUC. Subsequently, for the composite biomarker for the molecular staging of AD, we applied Gaussian LASSO, as described previously.
The developed models were validated in the independent validation cohort analyzed with the custom 21-biomarker panel developed within the study. To this purpose, the log2 of absolute quantification data was considered. To account for the different nature of the assay used on the validation cohort, biomarker values from the new dataset were recalibrated against the distribution observed in the discovery cohort. For each analyte, we derived scale parameters (median and IQR) from the discovery CTRL group. For the validation data, log2-transformed values (Q′) were transformed into standardized z-scores using the median and IQR, and then rescaled to match the reference distribution:
$${Q}^{{\prime} }={\log }_{2}Q$$
$${Q}^{{\prime} {\prime} }=\frac{{Q}^{{\prime} }-\mathrm{median}\left({Q}_{{\mathrm{validation}}}^{{\prime} }\right)+\mathrm{median}\left({{\mathrm{NPX}}}_{{\mathrm{CTRL}}_{\mathrm{discovery}}}\right)}{{\mathrm{IQR}}\left({Q}_{\mathrm{validation}}^{{\prime} }\right)}{\mathrm{IQR}}\left({Q}_{{\mathrm{CTRL}}_{\mathrm{discovery}}}\right)$$
The calibration coefficients are present in Supplementary Table 10.
Each model’s performance was then evaluated using ROC analysis. For the FTD versus CTRL comparison, n = 38 missing values of B4GAT1 were imputed using mean Q″ values in the CTRL and FTD groups. The 95% CIs of the AUCs were calculated by using 2,000 bootstrap replicates in the training and test sets using the R package pROC68. Spearman’s correlation analysis was applied to explore possible associations between the 21 bPRIDE biomarkers and neuropathological scores of the VARS cohort. Longitudinal changes in plasma ITGAV levels within PD, pro-PD and healthy CTRL participants from the PPMI cohort were assessed using linear mixed-effects models, including age and sex as covariates and participant ID as a random intercept. Post-hoc within-group comparisons across visits were adjusted using the Benjamini–Hochberg procedure.
Reporting summary
Further information on research design is available in the Nature Portfolio Reporting Summary linked to this article.