Transcriptomics-based disease trajectory analysis captures MASLD progression
We first sought to determine whether MASLD progression could be represented as a continuous molecular process using liver transcriptomic data alone. Specifically, we asked whether patients could be ordered along a disease axis that recapitulates histological severity while providing finer resolution than discrete staging. Given variability between patients, including the role of sex21, comorbid conditions22 and other parameters in the timing of disease progression23, we focused on modelling the molecular underpinnings of progression that are directly related to MASLD histological phenotypes, as these are common across all patients.
To test this hypothesis, we analysed RNA-seq data from 136 patients across two published cohorts9,24, adjusting for sex during data integration (Methods and Supplementary Tables 1 and 2).
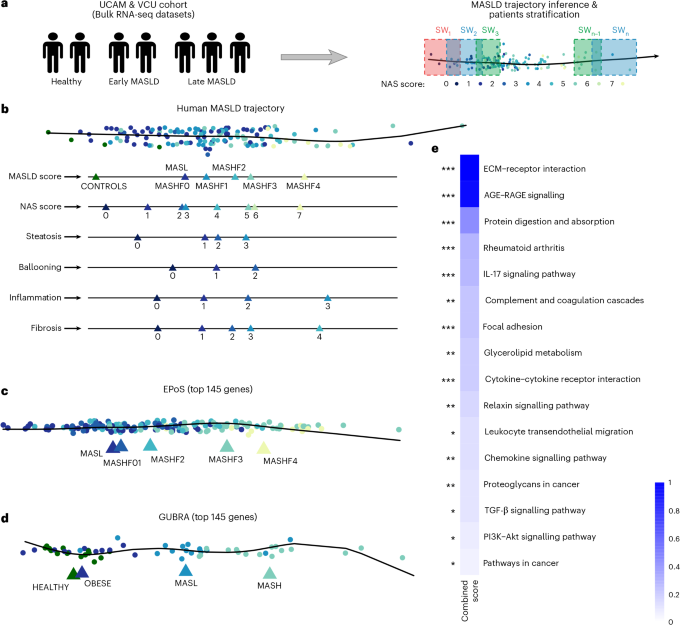
After excluding one outlier, we applied pseudo-temporal ordering to derive a transcriptomics-based disease trajectory (Fig. 1a, b and Extended Data Fig. 1a,b). The inferred trajectory showed strong concordance with histological measures, including steatosis, ballooning, inflammation, fibrosis and NAFLD activity score (NAS) (Pearson R = 0.96–1.0; P < 0.05 for most compared disease stages; analysis of variance followed by Tukey’s pairwise comparisons; Extended Data Fig. 1c), confirming alignment with established disease stages. Because the trajectory was inferred from bulk liver transcriptomes, it reflects the tissue’s overall molecular state and therefore captures both cell-intrinsic regulatory changes and shifts in cellular composition that accompany disease progression.

a, Schematic of pseudo-temporal ordering of patients based on bulk transcriptomics data from liver biopsies and stratification of patients into SWs. b, Pseudo-temporal ordering of patients based on transcriptomic data recapitulates disease progression based on individual phenotypes (steatosis, ballooning, inflammation and fibrosis), and based on the NAS and MASLD scores. c,d, Pseudo-temporal ordering of two independent, orthogonal datasets, based on the 145 genes that are most predictive of the trajectory, provides a linear and clear separation of the disease stages (EPoS dataset (c) and Gubra dataset (d)). Triangles show the average position of each histopathologically characterized stage on the trajectory. e. Functional enrichment analysis results of these 145 genes using EnrichR. Significance was assessed using a two-sided Fisher’s exact test, with P values adjusted for multiple testing using the FDR method. The combined score (c) has been calculated as c = log(P) × z-score, with z-score reflecting the deviation from the expected rank.
To validate the trajectory model, we tested it on two independent RNA sequencing (RNA-seq) datasets: the EPoS dataset, a large multi-cohort dataset encompassing 168 patients with MASLD across the full disease spectrum, and the Gubra dataset, comprising 26 healthy individuals with healthy weight and obese individuals, and 31 patients with MASLD and MASH8,25. Initial pseudo-temporal ordering of these patients showed a trend of disease progression; however, additional variance in both datasets was observed that did not fully correlate with disease progression (Extended Data Fig. 2a,b).
To identify the principal drivers of variance along the MASLD–MASH trajectory and assess their generalizability, we applied a random forest approach to the discovery cohorts (UCAM/VCU), identifying 145 gene transcripts predictive of disease stage and histopathological features (area under the curve (AUC) 0.62–0.73; Supplementary Table 3). This gene set corresponding to the identified transcripts more accurately recapitulated the disease trajectory across independent datasets8,25, improving linearity and stage separation compared with the full transcriptome (Fig. 1c, d). Feature selection was performed exclusively on the discovery data, ensuring no information leakage and supporting the model’s robustness across the larger, more heterogeneous EPoS and Gubra cohorts.
Finally, we evaluated the ability of our 145-gene signature to place longitudinal data from 58 patients of a different ethnic background (the Japanese cohort26) along the trajectory. We found that their location along the trajectory was largely consistent with changes in their histological profile, particularly where their disease regressed (Extended Data Fig. 2c–e). Together, these results demonstrate the generalizability of our 145 genes for MASLD trajectory inference.
The identified genes were enriched in pathways central to MASLD–MASH progression, including extracellular matrix (ECM)–receptor interaction and focal adhesion (associated with fibrosis), AGE–RAGE and interleukin (IL)-17 signalling (inflammatory responses), and TGF-β and PI3K-Akt signalling (wound healing and metabolic dysregulation). Other pathways, such as glycerolipid metabolism and cytokine–receptor interactions, reflect the metabolic and immune dysregulation characteristic of MASLD–MASH (Fig. 1e and Supplementary Table 4).
To capture gradual changes along the disease progression axis and gain deeper insights into the molecular changes driving MASLD progression, we divided patients into overlapping groups (‘sliding windows’; SWs), allowing us to detect progressive molecular shifts without imposing discrete stage boundaries. SWs can be viewed as moving windows along disease progression, analogous to smoothing a time series, enabling the detection of early, transient or delayed molecular events that are missed by discrete staging.
To optimize the SW sequence, we developed a graph-based method that maximized the information content of each window (Methods). Using this approach, patients were divided into 13 groups along the trajectory for functional network analysis (Methods, Fig. 1a, Extended Data Fig. 3 and Supplementary Tables 1 and 5).
Data-driven global MASLD/MASH network recapitulates key molecular mechanisms of disease
To organize the diverse molecular changes observed along the MASLD trajectory into an interpretable structure, we constructed a MASLD regulatory network that integrates coexpression modules, transcription factor activity and upstream signalling pathways.
First, we adapted our previously published method for generating phenotype-specific networks by integrating paired transcriptomics and phenotype data27 (Fig. 2a and Methods). Using weighted gene coexpression network analysis (WGCNA)28, we identified gene coexpression modules and linked them to key phenotypic features, including the NAS score, steatosis, ballooning and fibrosis (Fig. 2b and Supplementary Table 6). The ballooning score reflects hepatocyte injury, whereas the inflammation score reflects lobular immune infiltrates. The inflammation score was used as a covariate in the analysis, due to difficulty deconvolving its role as a cause versus effect and because it dominated the signal. Nonetheless it is already represented in the NAS score. Finally, to extract the modules associated with our histological phenotypes of interest, we used linear regression, identifying ten modules associated with at least one phenotypic feature (Fig. 2b and Methods). These modules were selected as significant predictors (non-zero coefficients, false discovery rate (FDR) < 0.05) for the phenotypic features, so the coefficient signs reflect their role in the models, not necessarily the direction of their correlation. For example, fibrosis increases with MEbrown and MEred, whereas MEsalmon and MEyellow adjust the prediction through their negative coefficients, although all four modules are positively correlated with fibrosis along the disease trajectory (Fig. 2c). After filtering genes that were not correlated with the eigengene of each module (Methods), the number of genes in each significant module ranged from 192 in the MEsalmon to 2,949 in the MEturquoise module (Supplementary Table 6).

a, Schematic of the approach to extract a reference MASLD network. b, Association (coefficient from a multivariate linear model) of the different gene coexpression modules with NAS score, steatosis, ballooning and fibrosis. Red indicates a positive coefficient and blue a negative coefficient. These coefficients represent the contribution of each module to the model and should not be interpreted as the direction of module expression changes along the pseudo-temporal trajectory shown in c. c, The heatmap shows the average scaled expression of the modules along the pseudo-temporal trajectory. The values for each module were calculated by averaging the scores of SW-grouped samples along their first principal component (eigengene). d, TFs whose regulons are enriched in the modules. The figure shows TFs per module, coloured according to the adjusted P value of the enrichment test. The presented TFs have been identified as enriched in multiple modules. Bold indicates TFs that are significantly deregulated (FDR < 0.05) in at least one SW (see SW analysis results). The complete list of TFs derived from the enrichment analysis is given in Supplementary Table 8. e, Enrichment of MASLD network and its components in known MASLD genes curated from the literature (top) or from MSigDB (bottom). Odds ratios were assessed using a one-sided Fisher’s exact test.
Reactome29 enrichment of the phenotype-associated modules highlighted patterns consistent with MASLD progression (Supplementary Table 7). MEbrown, associated with ballooning and fibrosis, showed robustly strong enrichment for protein translation (R-HSA-72766, FDR = 1.9 × 10−99) and ribosome biogenesis (R-HSA-72706, FDR = 5.5 × 10−59), reflecting hepatocyte stress and increased biosynthetic demand during injury30. MEred, also linked to fibrosis and ballooning, was enriched for ECM organization (R-HSA-1474244, FDR = 6.5 × 10⁻²³), aligning with well-established fibrogenic remodelling31. In contrast, MEblue, associated with steatosis and NAS, was enriched for gene-regulatory programmes (R-HSA-74160, FDR = 1.6 × 10⁻¹⁸) consistent with early metabolic and transcriptional reprogramming in lipid-laden hepatocytes32. Finally, MEyellow, associated with fibrosis and ballooning, showed strong enrichment for immune system pathways (R-HSA-168256, FDR = 1.8 × 10−47), capturing the inflammatory processes characteristic of advanced disease. Together, these phenotype–pathway correspondences provide confidence that the reference network recapitulates key molecular processes underlying steatosis, hepatocellular injury, inflammation and fibrosis in MASLD.
As a confirmation that our modules are following the expected dynamics reflected in the histology and the underlying biological processes, we evaluated the ‘activity’ of the modules along our SWs identifying two groups. Modules that work as predictors for all phenotypic features and are generally associated with ECM organization (MEred and MEsalmon) and inflammatory response (MEyellow and MEpurple) were less active in the beginning of the trajectory and peaking at later stages (Fig. 2b, c). In contrast, modules that are mainly associated with steatosis and NAS, with MEblue and MEpink also strongly related to metabolism, behave oppositely. Of note, MEtan, which acts as a positive predictor of ballooning and NAS, shows activity only in the early–mid stages (SW5–7), in agreement with histology.
Transcription factor (TF) enrichment analysis of the phenotype-associated modules identified 199 TF regulons across nine out of the ten significant modules (FDR < 0.05), with many converging on TGF-β-driven fibrogenic signalling (Supplementary Table 8). Among these, 65 TFs were shared across multiple modules (Fig. 2d). Core TGF-β regulators SMAD2, 3 and 4, were selectively enriched in the MEred module (FDR = 0.04, 5 × 10⁻⁵, 6.3 × 10⁻⁸ respectively; Supplementary Table 8), consistent with its link to ballooning and fibrosis (Fig. 2b). Enriched in the ballooning and fibrosis-associated modules, we found SP1, SRF and ETS1, known to interact with TGF-β signalling to promote the expression of tissue remodelling and fibrosis factors33,34. EGR1, a TGF-responsive TF previously linked to both steatosis and fibrosis35, was enriched across multiple modules, bridging early and late disease features (Fig. 2d).
HNF4A, a key regulator of liver development and morphogenesis36 and PPARG, which controls lipid storage and adipocyte differentiation in liver37, appeared across modules with opposing phenotype associations (MEbrown versus MEturquoise or MEyellow; FDR HNF4A = ~0.001, PPARG = 1 × 10⁻⁴ and 4.3 × 10⁻⁵; Fig. 2b,d), indicating divergent transcriptional programmes across disease stages. SREBF1, found in MEyellow (FDR = 0.05) and MEmagenta (FDR = 0.04), similarly bridges lipogenic regulation and early stress responses, consistent with its shift from metabolic control to activation under hepatocellular injury24,38.
Inflammatory and hypoxia-responsive TFs (NFKB1, RELA and HIF1A) were enriched in MEyellow (FDR = 6.8 × 10⁻¹¹, 9.6 × 10⁻¹¹ and 0.006, respectively), whereas CREB1 showed the strongest enrichment in MEbrown (FDR = 2.0 × 10⁻²⁴), reflecting distinct immune-driven39,40,41 versus hepatocyte-intrinsic42 stress transcriptional contexts (Fig. 2b,d and Supplementary Table 8).
To ensure comprehensive regulatory coverage, we additionally incorporated TFs differentially regulated along the disease trajectory (FDR < 0.05; Methods), yielding a combined TF module (DEA), in which 85 of the 199 enriched TFs showed stage-specific deregulation (Supplementary Table 8).
We then integrated the phenotype-associated modules, their enriched TFs and corresponding pathways (Supplementary Table 9 and Methods) to construct module-specific regulatory networks for each histological feature, as well as for our dynamically regulated TFs along the disease trajectory (Fig. 2a). These networks were then merged into a comprehensive MASLD–MASH disease network, henceforth referred to as the MASLD network for simplicity, to capture dynamic changes in cellular processes across disease stages (Fig. 2a, Methods and Supplementary Table 10). The resulting network contained 7,165 nodes and showed significant enrichment for previously reported MASLD-associated genes from both our curated literature set (Supplementary Table 11) and an established MSigDB43 gene set (MSigDB ID M39806; Methods and Fig. 2e).
As an orthogonal validation we used the same pipeline to generate a MASLD network using the larger EPoS dataset described above8,25. That network comprised 6,732 nodes (Supplementary Table 10) and the intersection of the two networks was 5,241 nodes (Jaccard index = 0.61, odds ratio = 7.11, Fisher’s exact test P = 0).
Sliding window analysis highlights molecular dysregulation in MASLD progression
We next sought to combine our reference MASLD regulatory network with our patient trajectory using our SW approach (Fig. 1a) to explore the molecular mechanisms underlying MASLD progression relevant to observed histological phenotypes.
Initially, we identified TFs that were dynamically regulated across MASLD progression, showing strong concordance with traditional stage-based stratifications (early, middle, late and NAS score-based patient stratification), while providing greater temporal resolution (Fig. 3a and Supplementary Table 12). In total, 122 TFs exhibited at least one significant deregulation event along the trajectory (FDR < 0.05), of which, 57 were also detected by mild–moderate–severe or NAS-based analyses with concordant directionality. This shared set included TF clusters enriched for Toll-like receptor signalling (for example FOS, JUN, CREB1, TP53, NFKB1/2 and RELA; R-HSA-168898, FDR = 5.3 × 10⁻⁵), oestrogen receptor-mediated signalling (for example ESR1, RUNX1 and MYB; R-HSA-8939211, FDR = 6.4 × 10⁻⁷) and cytokine signalling (for example EGR1, IRF and STAT family members; R-HSA-1280215, FDR = 2.8 × 10⁻⁸; Extended Data Fig. 4).

a, Results from TF activity analysis in two types of discrete patient stratification (mild, moderate, severe and NAS scores), and the pseudo-temporal trajectory. The colour indicates a change in TF activity compared with the previous disease stage. Only results with FDR < 0.01 are shown. b, Mean phenotype and NAS pathologist scores along the SW trajectory.
SREBF1 was consistently upregulated in early and intermediate disease states across all stratifications (in SW4 and SW9 according to the SW approach), confirming its pro-steatotic role24,44. However, only the trajectory-based and NAS-based approaches captured its downregulation in later stages45, illustrating the benefit of increased granularity.
Beyond this shared signal, the trajectory-based approach uniquely identified several key regulatory events missed by discrete classifications, including early downregulation of HNF4A (SW5), NR1I3 (SW5) and HNF1A (SW3 and SW5), reflecting disrupted hepatocyte metabolic identity, inflammatory signalling and tissue remodelling46,47,48 (Fig. 3a). Conversely, sustained upregulation of pro-fibrotic regulators such as SRF49 and dynamic regulation of TGF-β pathway components, including downregulation of the inhibitory SMAD7 (ref. 50) (SW2), were detected only along the SW trajectory (Fig. 3a). Additional TFs (for example MYC, STAT1 and NF-κB1) displayed complex, stage-dependent regulation, underscoring the ability of trajectory-based analysis to capture nuanced and biologically meaningful regulatory dynamics during MASLD progression (Fig. 3a).
These results were largely validated in an orthogonal analysis of the EPoS dataset8,25, where 69 TFs were deregulated in at least one SW, 57 of which overlapped with our primary analysis (Jaccard index = 0.43, odds ratio = 76.03, Fisher’s exact test P < 2.2 × 10⁻¹⁶). Deregulation directionality, based on cumulative activation scores, showed high concordance between datasets with an average Pearson correlation coefficient (PCC) of 0.56 (Extended Data Fig. 5a). The average PCC of cumulative activities per SW was 0.38, revealing two opposing trends along the disease trajectory (Extended Data Fig. 5b). Notably, PCC decreased monotonically in early stages (SW2–SW5), indicating divergence in early molecular profiles between cohorts, likely due to the absence of healthy samples and higher MASLD variable values in SW1 of the EPoS dataset, which makes this group more similar to SW2 than in the UCAM/VCU cohort. In contrast, PCC increased in middle and late stages, demonstrating that despite cohort-specific differences, the trajectory-based approach captures consistent molecular programmes as disease progresses (Extended Data Fig. 5b).
An intriguing cluster of TFs, including MEF2A, MEF2C, MYOG, NKX2-5 and MYOD1, exhibited unique activity patterns in our trajectory analysis that were not detected using traditional discrete patient staging (Fig. 3a). Their activity peaked during SW5–SW6 and then sharply declined at SW7, suggesting either a resolution of activation or a shift in regulatory dynamics. Notably, no significant changes in their activity were observed in later stages, indicating a potential stabilization of their regulatory influence as the disease progressed (Fig. 3a). These TFs, known primarily for their roles in myogenesis51, have also been implicated in hepatic stellate cell activation and their transition to a myofibroblast-like phenotype, a critical driver of fibrosis52. MEF2A–MEF2C and NKX2–5 also have documented roles in macrophage differentiation and inflammatory programming53,54,55, although not specifically related to MASLD. Further research is needed to understand the role of this TF cluster in MASLD progression.
To explore the underlying molecular processes, we employed a network propagation-based strategy to extract differentiated network signatures for each SW from the MASLD reference network (Methods). Reactome analysis of these networks identified 111 pathways exhibiting progressive changes along the disease trajectory (Extended Data Fig. 6, Supplementary Table 13 and Methods). Signal transduction, including TGFβ, receptor tyrosine kinase and others, and multiple immune pathways increased with disease progression (Extended Data Fig. 6), consistent with escalating inflammatory and signalling dysregulation. ECM organization pathways, linked to fibrosis, such as integrin and non-integrin membrane-ECM interactions, were upregulated predominantly from mid to late stages (Extended Data Fig. 6). Metabolic pathways showed more complex dynamics: lipid metabolism was initially downregulated (SW3–5) but showed modest upregulation after SW8, whereas glucose metabolism increased persistently from early stages, consistent with insulin resistance56. Orthogonal validation in the EPoS dataset8,25 identified 95 associated pathways, with 72 overlapping (Jaccard index = 0.54, odds ratio = 7.23, Fisher’s exact test P = 6.3 × 10⁻¹²; Supplementary Table 13). Pathway deregulation directionality was concordant across datasets (average PCC = 0.46; Extended Data Fig. 7a), and cumulative pathway activities per SW showed even higher agreement (average PCC = 0.52; Extended Data Fig. 7b), mirroring oscillatory patterns observed in TF-based analyses but with higher overall correlation.
Finally, we compared pathway dysregulation across SWs with histopathological scores (steatosis, ballooning, inflammation, fibrosis and NAS; Fig. 3b). Although these scores increased overall with disease progression, several pathways showed dysregulation earlier than histological changes. For example, extracellular matrix pathways were upregulated at SW8, attenuating the overall increase in fibrosis observed later along the trajectory, aligned with significant changes in multiple TFs (Fig. 3a) in that stage, indicating that molecular readouts may detect MASLD progression earlier than conventional assessments.
Overall, the enhanced resolution of our sliding-window-based approach provides a comprehensive molecular landscape of MASLD progression, shedding light on the interplay among immune activation, fibrotic remodelling and metabolic dysregulation over time.
Cell-type deconvolution along the MASLD trajectory reveals network changes associated with tissue composition
Changes in liver cell composition and state are hallmarks of MASLD progression and reflect injury- and inflammation-driven remodelling of the hepatic microenvironment1. Characterizing the molecular programmes underlying these shifts can help contextualize disease mechanisms and inform biomarker discovery.
To characterize cellular dynamics along the trajectory, we performed cell-type deconvolution of bulk liver transcriptomes (Methods, Extended Data Fig. 8 and Supplementary Table 14). Hepatocytes remained the dominant cell type but progressively declined from early to late stages (from 0.66 in SW1 to 0.52 in SW13), consistent with increasing contributions from other hepatic and immune populations. To obtain robust estimates, haematopoietic cells were aggregated into myeloid and lymphoid lineages, excluding macrophages, which showed a distinct and progressive increase, particularly after mid-progression (SW6; Fig. 4a and Extended Data Fig. 8). Lymphoid cells (predominantly T cells and natural killer (NK)/NKT cells) increased more markedly than other myeloid populations, alongside rising cholangiocyte and fibroblast signals, reflecting heightened inflammatory and fibrogenic activity. In this analysis, the ‘fibroblast’ annotation predominantly reflects hepatic stellate cells, which comprise ~70% of this category in the reference single-cell atlas57. In contrast, endothelial cell proportions remained relatively stable, suggesting preservation of vascular structure even in advanced disease.

a, Cell type deconvolution of patient transcriptomic data along our MASLD trajectory b, Prediction of cell types with which the deregulated processes are associated after excluding gene sets of these processes that could have been identified as differentiated by the mere change in abundance of cell types. Only enrichments with P < 0.05 (Fisher’s exact test) are shown; pathways without significant enrichment were excluded.
We next linked cell types to deregulated processes along the trajectory. To distinguish true process dysregulation from shifts in cell composition, we removed genes whose expression changes could be explained by changing cell proportions, using pseudo-bulk profiles derived from healthy liver single-cell data (Methods).
Enrichment analysis of the remaining gene sets revealed cell-type-specific pathway associations (Fig. 4b and Supplementary Table 15). As expected, lipid metabolism was primarily hepatocyte-associated, immune pathways mapped mainly to macrophages, neutrophils and migratory dendritic cells, and ECM and fibrotic processes were strongly linked to fibroblasts (Fig. 4b). Non-immune signalling pathways, including Wnt, receptor tyrosine kinase and Rho signalling, were predominantly associated with endothelial cells, with additional contributions from fibroblasts, cholangiocytes and immune cells. Together, these results highlight coordinated crosstalk between parenchymal, stromal and immune compartments during MASLD progression.
MASLD Trajectory-specific biomarkers through integrated plasma–liver expression analysis
From a clinical perspective, the key question is whether molecular trajectories inferred from liver tissue can be accessed non-invasively and used for patient stratification. We therefore focused on identifying circulating biomarkers that not only predict fibrosis stage but also position patients along the continuous disease trajectory.
Govaere et al.58 recently identified 194 genes whose expression correlates between liver tissue and blood plasma across MASLD progression stages. We reasoned that biomarkers derived from this set would be detectable in circulation while still reflecting hepatic molecular processes. To further prioritize markers with mechanistic relevance to disease progression, we focused on the subset of 57 genes that were also present in our MASLD regulatory network, as these genes are directly embedded within disease-associated regulatory programmes. (Fig. 5a and Supplementary Table 1).

a, Selection of candidate biomarkers. A 57-gene set was defined by intersecting the global MASLD network with plasma–liver-correlated genes58, followed by random forest classification of fibrosis stage (F0–2 versus F3–4). Feature importance and the elbow method identified a reduced 15-gene subset. b, Performance of the 57- and 15-gene classifiers compared with non-invasive clinical scores and a previously published three-gene biomarker panel in the Fujiwara cohort. Both the 57-gene (AUC = 0.8; 95% CI = 0.72–0.89) and the 15-gene (AUC = 0.79; 95% CI = 0.7–0.88) classifiers showed comparable performance with FIB-4 (AUC = 0.81; 95% CI = 0.73–0.89; DeLong test, two-sided P = 0.9). Higher AUC values were observed against APRI (AUC = 0.74; 95% CI = 0.65–0.83; P = 0.21) and NFS (AUC = 0.71; 95% CI = 0.62–0.8; P = 0.06), although these differences were not statistically significant (two-sided DeLong test). In contrast, both models outperformed the three-gene panel (AUC = 0.64; 95% CI = 0.56–0.72; P = 0.0004; two-sided DeLong test). 95% CIs are shown for AUC, where the central value represents the AUC estimate and error bars indicate the corresponding 95% CI derived from the receiver operating characteristic (ROC) analysis. AUC is reported as a threshold-independent measure of model discrimination. Sensitivity, specificity and accuracy are reported as point estimates from a single evaluation on independent external cohorts; therefore, no data distribution or error bars are shown for these metrics. c,d, Benchmarking against FIB-4 and the established three-gene biomarker panel in the EPoS cohort. ROC curves (c) and performance (d) using additional metrics. Both the 57-gene (AUC = 0.86; 95% CI = 0.8–0.92) and 15-gene (AUC = 0.85; 95% CI = 0.79–0.91) classifiers outperformed FIB-4 (AUC = 0.76; 95% CI = 0.69–0.84) and the three-gene published panel (AUC = 0.63; 95% CI = 0.54–0.72), with statistically significant differences (two-sided DeLong test; P = 0.015 and P = 0.026 against FIB-4, for both 57 and 15-gene classifiers, respectively; P < 0.001 for both versus the three-gene panel). e, ROC curve for fibrosis classification of patients using external plasma proteomics data for our 57-gene (AUC = 0.83) and 15-gene (AUC = 0.79) classifier against the published three-gene panel (AUC = 0.71), with statistical comparisons calculated using two-sided DeLong tests; 57-gene versus 15-gene: P = 0.03; 57-gene versus three-gene: P = 0.00006; 15-gene versus three-gene: P = 0.05. Only two proteins (IGFBP7 and SEMA4D) were used for the classification based on the external three-gene panel, providing the closest possible approximation based on their availability and presence in the plasma proteomics dataset (SSC5D was absent). f. Random forest regression predicting patient positions along the MASLD trajectory in the Gubra cohort; predicted positions (57 genes) versus transcriptome-derived positions are shown (R2, Pearson correlation). g,h, Inferred patient trajectory positions on the external validation plasma proteomics dataset, using either the whole proteome (g) or only the 57 biomarkers (h). Each point represents an individual patient (biological unit of analysis; no technical replicates). Group sizes correspond to patients in the external proteomics dataset (early MASLD: n = 112; late MASLD: n = 79). P values were obtained using a two-sided Wilcoxon rank-sum test, comparing pseudo-time distributions between early and late disease stages. Boxplots show the median (centre line), interquartile range (IQR) (box) and whiskers extending to 1.5 × IQR. i. GWAS trait enrichment of the 57-gene biomarker panel; significant categories after FDR correction are shown in orange (Fisher’s exact test on the biomarkers associated with each of those categories, against the whole GWAS as the background).
We trained a machine-learning model (random forest classifier) using the 57-gene set to predict fibrosis stage (F0–F2 versus F3–F4), achieving 86.2% accuracy in the UCAM/VCU cohort (AUC = 0.769). Applying the elbow method to feature importance yielded an optimal 15-gene subset, which might be more tractable for clinical application (Fig. 5a and Supplementary Table 1). Validation in two independent cohorts showed robust performance. Specifically, in the Fujiwara cohort26, the model achieved an AUC of 0.803 (0.794 for the 15-gene subset), performing similarly or outperforming established clinical scores (FIB-4, AST-to-platelet ratio index (APRI) and NAFLD fibrosis score; NFS) and a three-gene biomarker panel59 (Fig. 5b). In the EPoS cohort8 the model reached an AUC of 0.86 (0.85 for 15 genes), significantly outperforming the three-gene published biomarker panel (DeLong test; P < 0.001) and the FIB-4 AUC (by 10%; P = 0.015 and 0.026, respectively, for both models; Fig. 5c), retaining a stronger performance in all evaluation metrics tested (Fig. 5d). Robustness analysis against 300 random 57-gene signatures confirmed superior performance of the curated gene set in both external datasets (P < 1 × 10−64; Extended Data Fig. 9a). Although FIB-4 was originally developed for the detection of advanced fibrosis, we include it here as a commonly used non-invasive clinical benchmark.
We further tested model generalizability by applying the transcriptomics-trained classifier to plasma proteomic data, where it maintained strong performance (AUC = 0.83; 0.79 for the 15-gene subset) significantly outperforming the published three-gene panel (DeLong test; P = 0.00006 and 0.05, respectively, for the 57 and 15-gene classifiers; Fig. 5e, Extended Data Fig. 9b and Methods). Together, these results demonstrate that the plasma-based gene signature generalizes across cohorts, outperforms established non-invasive tests and directly translates into blood proteomics.
To enable continuous patient positioning along the disease trajectory, we trained a random forest regression model using the 57-gene signature. In the UCAM/VCU cohort, the model achieved strong and consistent predictive performance (R2 = 87.9%, P = 1.66 × 10⁻⁸; mean squared error (MSE) = 0.008 across 1,000 iterations of fivefold cross-validation), accurately recapitulating increasing MASLD severity (Extended Data Fig. 9c,d). Validation in the independent EPoS cohort8 confirmed this performance (R2 = 85.1%, P = 8.04 × 10−62), with predicted positions tracking progressive MASLD stages (Extended Data Fig. 9e), whereas random 57-gene signatures did not (R2 = 0.14; Extended Data Fig. 9f).
Further validation in the Gubra dataset25 (Methods) demonstrated similar accuracy (R2 = 85.6%, P = 1.4 × 10⁻²⁶), correctly separating healthy or obese individuals from patients with MASLD or MASH along the trajectory (Fig. 5f and Extended Data Fig. 9g), with 89.2% of early-trajectory individuals classified as healthy/obese and 89.7% of late-trajectory individuals as MASLD/MASH. Finally, applying the same model to plasma proteomics data successfully recapitulated disease progression at the protein level (P = 1.09 × 10⁻¹⁸; Fig. 5g,h). Together, these results demonstrate that the 57-gene signature robustly predicts MASLD progression across cohorts and omics layers, supporting its potential for non-invasive staging and longitudinal monitoring.
To assess genetic support for the 57-gene MASLD biomarker panel, we queried the GWAS Catalogue (v.1.0)60. A total of 47 of the 57 genes were associated with at least one complex trait, predominantly related to metabolic, cardiovascular and liver phenotypes (Extended Data Fig. 10a,b and Supplementary Table 16). Nearly half of the genes (27 of 57; 47.4%) were linked to multiple trait categories, suggesting pleiotropy. Enrichment analysis confirmed significant overrepresentation of metabolic (FDR = 2.33 × 10⁻⁵), cardiovascular (FDR = 0.0021) and liver-related traits (FDR = 0.0032) relative to the background (Fig. 5i). Although GWAS overlap alone does not establish causality, the enrichment of trajectory-associated genes near MASLD GWAS loci supports consistency with existing genetic studies, supporting the biological relevance of the biomarker panel.
To explore potential therapeutic intersections, we mapped approved and investigational compounds to the 57-gene biomarker panel (Supplementary Table 17). This revealed drug–target associations spanning core MASLD processes. For example, small molecules targeting COL3A1 have indications related to ECM remodelling and fibrotic disorders (for example Dupuytren contracture and Peyronie’s disease); those targeting CXCL9 and SERPINE1 are indicated for inflammatory and immune signalling-related conditions (for example, chronic bronchitis, Alzheimer’s disease and various cancers). Small molecules with indications for coagulation and vascular diseases, such as atrial fibrillation, acute coronary syndrome or chronic kidney disease, target F11 and AGT; metabolic or hepatocellular stress pathway-related indications were linked to ACAT2 and GPC3. Although exploratory, these patterns reinforce the biological relevance of the biomarker panel and illustrate how a trajectory- and network-informed framework can support hypothesis generation for biomarker-guided, stage-aware therapeutic prioritization in MASLD.
Together, these results define a network-anchored and genetically supported biomarker framework that captures MASLD progression as a continuous molecular trajectory and enables robust, non-invasive stratification of disease stage across cohorts and molecular layers.